


Elasticsearch, Logstash, and Kibana are the three open-source technologies that make up the acronym ELK Stack.
Elasticsearch
The trio’s first open-source project, Elasticsearch, was made available. The search engine is distributed, RESTful, and JSON-based. It serves as the foundation of the ELK stack and stores data centrally for analytics and search.
Logstash
Logstash is a server-side data processing pipeline that is open source and free. It can accept data from various sources, alter it, and send it to your stack.
Kibana
Kibana, a free and open-source interface that lets you visualize data acquired using Elasticsearch and Logstash, is known as “the window” into the ELK stack. You can produce histograms, line graphs, pie charts, sunbursts, and more using Kibana.
The ELK Stack
Although the ELK stack is, by definition, free and open, it can ultimately be extremely expensive due to infrastructure costs. To avoid these costs, you can either host the ELK stack on one of the main cloud platforms like AWS, Azure, or GCP, or you can use the Elastic Cloud. It begins at about $16 per month. The self-managed Elastic Cloud powered by Kubernetes is another option.
Top 10 Best Alternatives to ELK Stack
The ELK stack has drawn a large number of users; however, scaling can be very expensive, and there are many competitors that offer the same product for less money. There have been numerous problems with the Elasticsearch engine as well, and because it “guesses” what will happen, it burdens your engineers with labor rather than letting them concentrate on other crucial duties. We have therefore made the decision to build a list of ELK stack substitutes that offer superior, more dependable solutions at a lower cost.
1. Logtail

Due to its custom-built technology and storage provided by ClickHouse, Logtail provides an ELK stack alternative that is significantly more resource-efficient, less expensive, and faster. You may spend less time debugging and troubleshooting by using Logtail to collect logs from every layer of your stack and to make the best use of the data that has been collected.
Utilizing its Google Docs-like built-in features. You can share logs with your coworkers, provide comments on them, and archive significant log pieces. Additionally, you can gain from Logtail’s presence and absence notifications, which can help you identify problems before they worsen.
2. Sumo Logic

For the full stack, whether cloud, on-premises, or hybrid, Sumo Logic provides a comprehensive range of log management capabilities. With the help of centralized data visualization, you can see emerging trends and stop errors in their tracks before they can do any damage by identifying them early on.
Predictive analytics, anomaly detection, and outlier detection give you in-depth and thorough insights into the performance of your design. Real-time visibility into cloud apps and infrastructure on AWS, Azure, and GCP is provided by Sumo logic.
3. LogicMonitor

For hybrid and multi-cloud settings, Log Intelligence at Scale is provided by LogicMonitor. Your data are centrally located, linked together, and contextualized with a focus on internal compliance and data hygiene. You can consolidate your monitoring with LogicMonitor and correlate pertinent logs and metrics on a single platform.
For on-premises and cloud infrastructures, it provides more than 2000 integrations, modules, and pre-built templates. Given that it provides query possibilities for users of all skill levels, LogicMonitor is genuinely user-friendly. You can also obtain unprocessed data that is up to 12 months old.
4. Loggly

A log management and aggregation product from SolarWinds is called Loggly. Currently, it is among the most widely used market solutions. An agentless log analyzer called Loggly collects information straight from application servers. Loggly can retrieve data from installed applications using a token or the common Syslog via HTTP(s).
It supports numerous languages and systems and can work with text-based logs from any source. Ruby, Java, Python, JavaScript, PHP, Tomcat, Apache HTTP Server, Syslog-ng, rsyslog, and many other programming languages are supported. The resolution and repair of operational issues is Loggly’s main priority.
5. Sematext

Sematext is a service that logs and monitors activity. You may gather and store logs from any data source in one place thanks to its support for centralized logging. Data can be gathered from systems, servers, apps, databases, containers, and more. You may use Sematext to view your logs in real-time as they are uploaded to the cloud from various data sources.
With the benefit of a sophisticated and hosted solution, it employs the ELK stack for data collection and transformation, searching, filtering, and analysis, and finally, data management and visualization. Real-time alerts on metrics and logs speed up troubleshooting. To speed up the process, log analysis and anomaly detection are used.
6. LogDNA
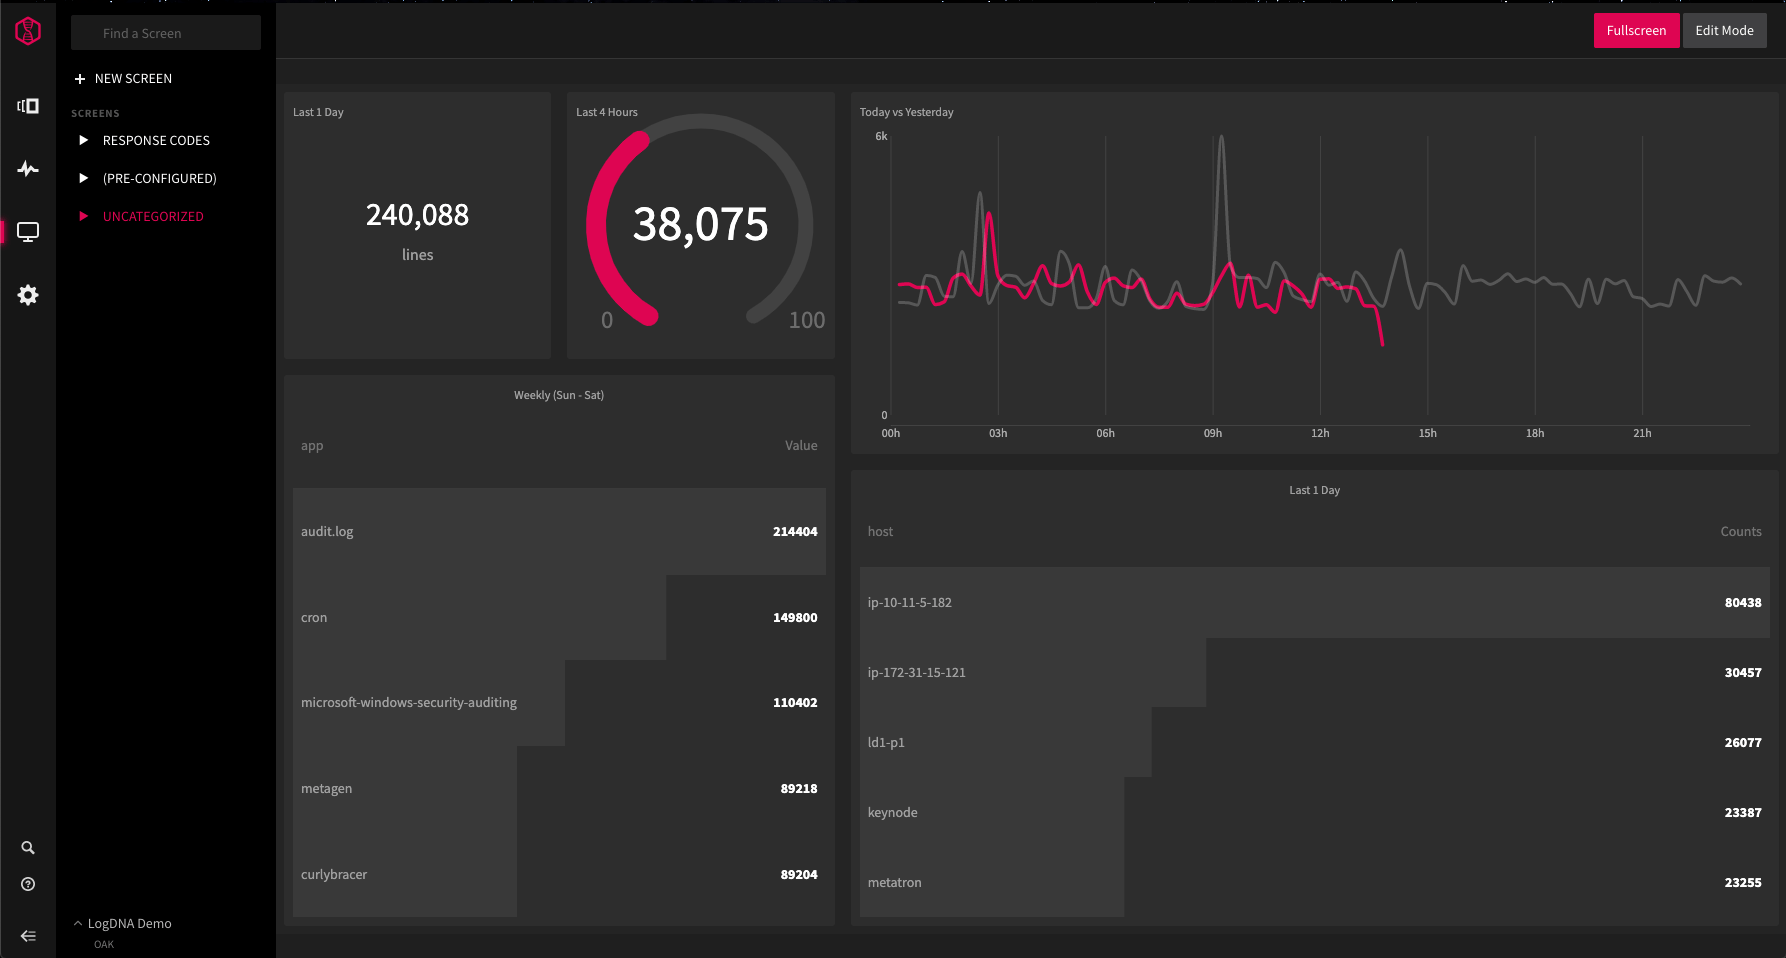
On ingestion, LogDNA parses the main types of log lines and provides Custom Parsing Templates. You can rapidly explore logs from any source, filter your logs based on app, host, or cluster, and do searches on your logs using basic keywords, exclusion terms, chained expressions, and data ranges.
Alerts can be generated from a stored View or based on presence or absence, and they can be reported via PagerDuty, Slack, or using a custom Webhook. Additionally, LogDNA enables you to share and save views for common Filters and Searches. Built on Elasticsearch is LogDNA. Filtering, log grouping by source, and other functions are handled through a web-based GUI.
7. Dynatrace

You can view and keep track of the logs for all of your mission-critical processes using Dynatraces’ Log Monitoring portfolio. You may monitor and understand log data in the context of the rest of your infrastructure in real time by easily creating custom log metrics.
By correlating log messages with issues and exploiting this correlation in root-cause analysis, artificial intelligence (AI) may analyze logs and filter them based on keywords or timeframes. If you utilize Dynatrace as a SaaS, you can use Log Monitoring v1 or Log Monitoring v2. The documentation for Dynatrace provides all the details.
8. Graylog

Graylog uses a variety of model kinds. Alternatives include the Small Business and its Enterprise. The last choice is Graylog Cloud, which has the same features as its Enterprise version but is hosted on the cloud to save you money on infrastructure expenditures.
It performs well at analyzing, providing data visualization, and parsing logs from any data source. Elasticsearch and MongoDB serve as its foundation. Each widget on the dashboard gives users access to a different set of data. There are several available views, charts, graphs, and counts.
9. New Relic

Infrastructure monitoring with New Relic allows for quicker visibility and troubleshooting. With only a few clicks, users can drill down from Kubernetes to a single log tracing using New Relic’s all-in-one data observation tool.
With New Relic’s extensive customization options, it makes no difference if you operate from one or several on-premises clouds; you will have access to precise, accurate, and customized metrics in real time and on an unlimited scale. AWS, Azure, GCP, MYSQL, NGINX, Kafka, and other well-known connections are all supported via the open and adaptable integration network known as New Relic.
10. Splunk

Splunk is a cutting-edge log management and monitoring tool that is still very young. It supports augmented reality and is accessible on mobile devices. Splunk offers you options for searching, filtering, diagnosing, indexing, and reporting, in addition to log management. Additionally, it includes dashboards that are simple to use and can be broken down into a variety of pertinent parts.
Distributed tracing is a technique that Splunk utilizes to keep track of events, failures, and performance problems. Splunk is quick when looking for recent data. It lags behind, though, when collecting data over a longer time period or when spotting trends. Splunk, on the other hand, offers a variety of extra functions. Live logging, S3 backup, Heroku support, Github integration, JIRA integration, and more features are among them.
Conclusion:
In this article, we examined the Elastic stack in more detail. We looked at each of its products separately—Elasticsearch, Logstash, and Kibana—and then examined how they complement one another and where they fall short. Then we suggested a list of the top alternatives to the Elastic stack.